 English
 Español
 Français
 Deutsch
 Italiano
 Português
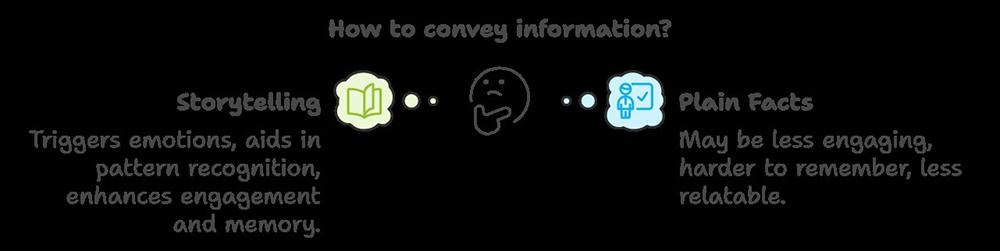
Humans typically tend to respond to stories more than to pure facts, statistics, or the like because they are hardwired to do so. Storytelling is the means by which emotions and the brain's natural processing of information are exploited. When it comes to the subjects of people being able to understand, budge emotionally, or internalize data through the use of stories and statistics, stories act as means of connecting emotionally, whereas data, stats, and numbers often function as means of logic, which are more distant and abstract and consequently become more difficult to comprehend or less interesting to an audience.
Overcoming the gap between storytelling and data-driven presentations inevitably requires melding the emotional impact with the factual basis. The following passages provide an overview of this situation and practical ways to make the connection:
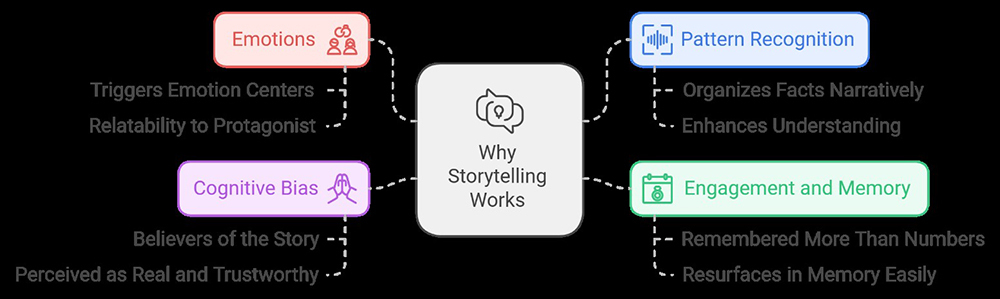
Why storytelling works
- The role of emotions: stories trigger the emotion centers of the brain that make the information more related. When a person can see themselves in the protagonist's actions or situations, they are more likely to get involved.

Pattern recognition: humans have great pattern recognition ability, and the stories aid in organizing the facts in a narrative format, which is meaningful. This makes the data more understandable.
Engagement and memory: stories are remembered more than plain numbers. A well-crafted plot can gather and resurface in memory at a rate that is less than a noticed set of data.
Cognitive bias: it is not easy to switch people from this track since the ones who have a major interest in stories are actual believers of that particular story, as it seems more real and thus becomes more trustworthy. Indeed, it is not heard, it is experienced.
Challenges with facts, stats, and numbers
Cognitive overload: numbers and statistics can easily be overwhelming hence, without context; they will be hard to be processed. The human brain is only capable of dealing with a limited amount of information at a time in its raw state.
Detachment: pure data may feel too impersonal and, thus, render it difficult for the audience to connect emotionally with it. It could be seen as irrelevant, if it is without any context or human elements.
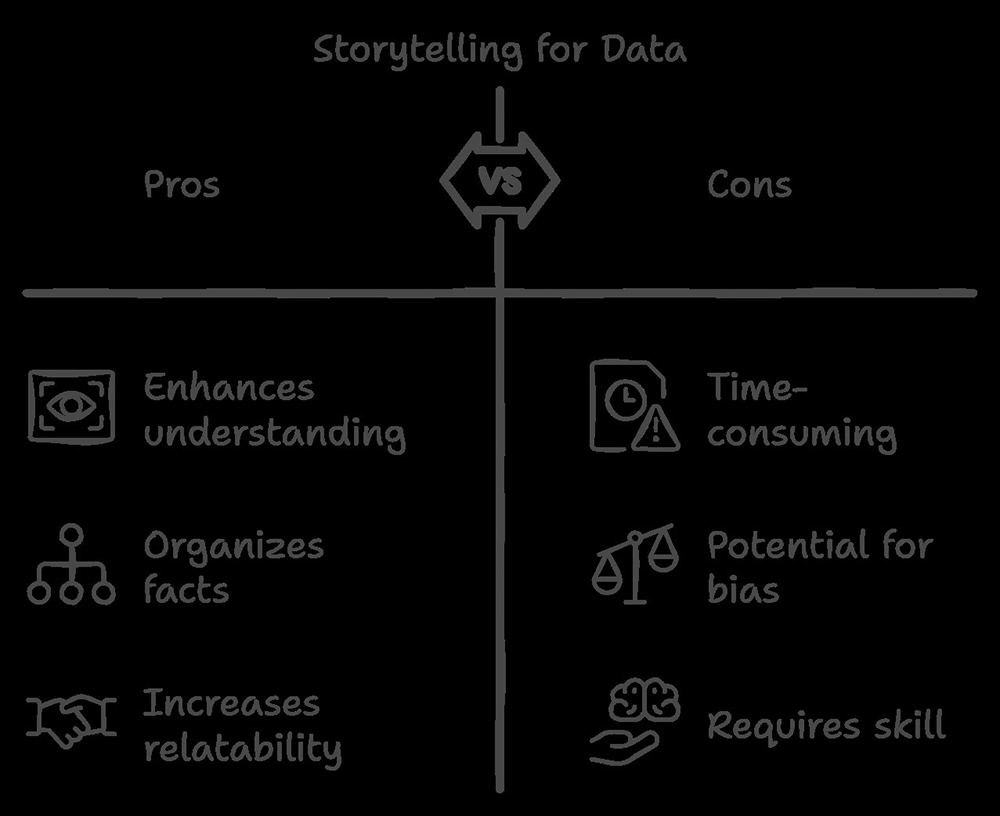
- Complexity: data, in fact, is a type of data that needs to be interpreted, and this process sometimes involves a misinformation caused by not understanding the context. It is a challenge to transform numbers into an understandable language for a wider audience.
Bridging storytelling and data
Bringing the data to life: weave facts and statistics into a story. The story could be the comparison of numerous use cases or a unique scenario that is true. Instead of saying, "45% of people do X," you could get the story going, "John, one of the 45%, does X..."
Data visualization: visuals (graphs, charts, and infographics) can make the complex numbers much simpler and keep the attention of the audience. In addition to the analogs, you will be able to include visuals that will result in the audience not solely knowing but understanding and feeling the impact caused by the data.
Personalization: turn dry numbers into something that people can relate to. For example, instead of saying “1 in 10 people suffer from X,” you could say, “In a group of 10 people, one person would suffer X.”
Put weight on the effects, not just the numbers: look at the intangible aspect of the narrative besides numbers. Instead of just listing facts, explain their implications for real-world scenarios. What does a 20% increase mean for the customer? What human experiences do these statistics represent?
Combine emotion and logic: start with a story to engage emotions and follow with data to reinforce the argument. A well-structured narrative can create a need for data, and the data, in turn, satisfies that need by providing logical proof.
Data-driven storytelling: begin with data insights, but frame them in a way that builds curiosity or poses a challenge. For example, “We’ve noticed a surprising trend in customer satisfaction... let’s explore why.”
Call to action: use stories to make data actionable. Explain how the insights can lead to a better outcome or solution, emphasizing both the personal (emotional) and factual (logical) reasons for action.
Example techniques
Case studies: real-world case studies blend storytelling and data. They show how an individual or business was impacted by specific actions or decisions, combining emotional engagement with factual backing.
Scenario planning: present hypothetical scenarios based on data trends. You can create a narrative about what could happen if certain trends continue, using stats to back up these future predictions.
Testimonials: use testimonials or personal stories to humanize the data. A single testimonial can make a statistic feel more relevant to an audience, bridging the emotional gap.
Application in marketing, education, or management
Marketing: instead of listing product features and numbers, tell a story of how the product transformed a customer's life, and then follow it up with data showing similar results for others.
Education: teachers can use storytelling to explain scientific or historical data, making it more engaging for students. For example, the story of a historical figure's decision-making process can make war statistics more compelling.
Management: in leadership, telling a story about how a team overcame challenges can motivate others more effectively than just presenting success metrics.
Conclusion
To convince an audience and break barriers, integrating storytelling with data is essential. A balance of emotional engagement and logical evidence makes the message compelling, relatable, and memorable. By creating narratives around the data, contextualizing it, and making it personal, you make facts and numbers easier to digest, more persuasive, and harder to forget.


